
Version 2 of my survey tool scores a finished survey five different ways. You pick one from a menu, and the choice reaches everything downstream: the writing prompts, the columns on your data tab, the charts, and the email your respondent opens.
This matters if you have a framework. Most consultants, coaches and speakers do: four pillars, five stages of readiness, three phases of growth. Version 1 flattened all of it into one percentage. Version 2 carries your structure through to the end.
The tool is free and Apache licensed, at coroin.app/#survey.
Two decisions, five choices
What each respondent sees. One overall result, a result for each facet, or both.
How each shown facet is scored. As a trait measured several ways (Average), or as a ladder climbed in order (Maturity).
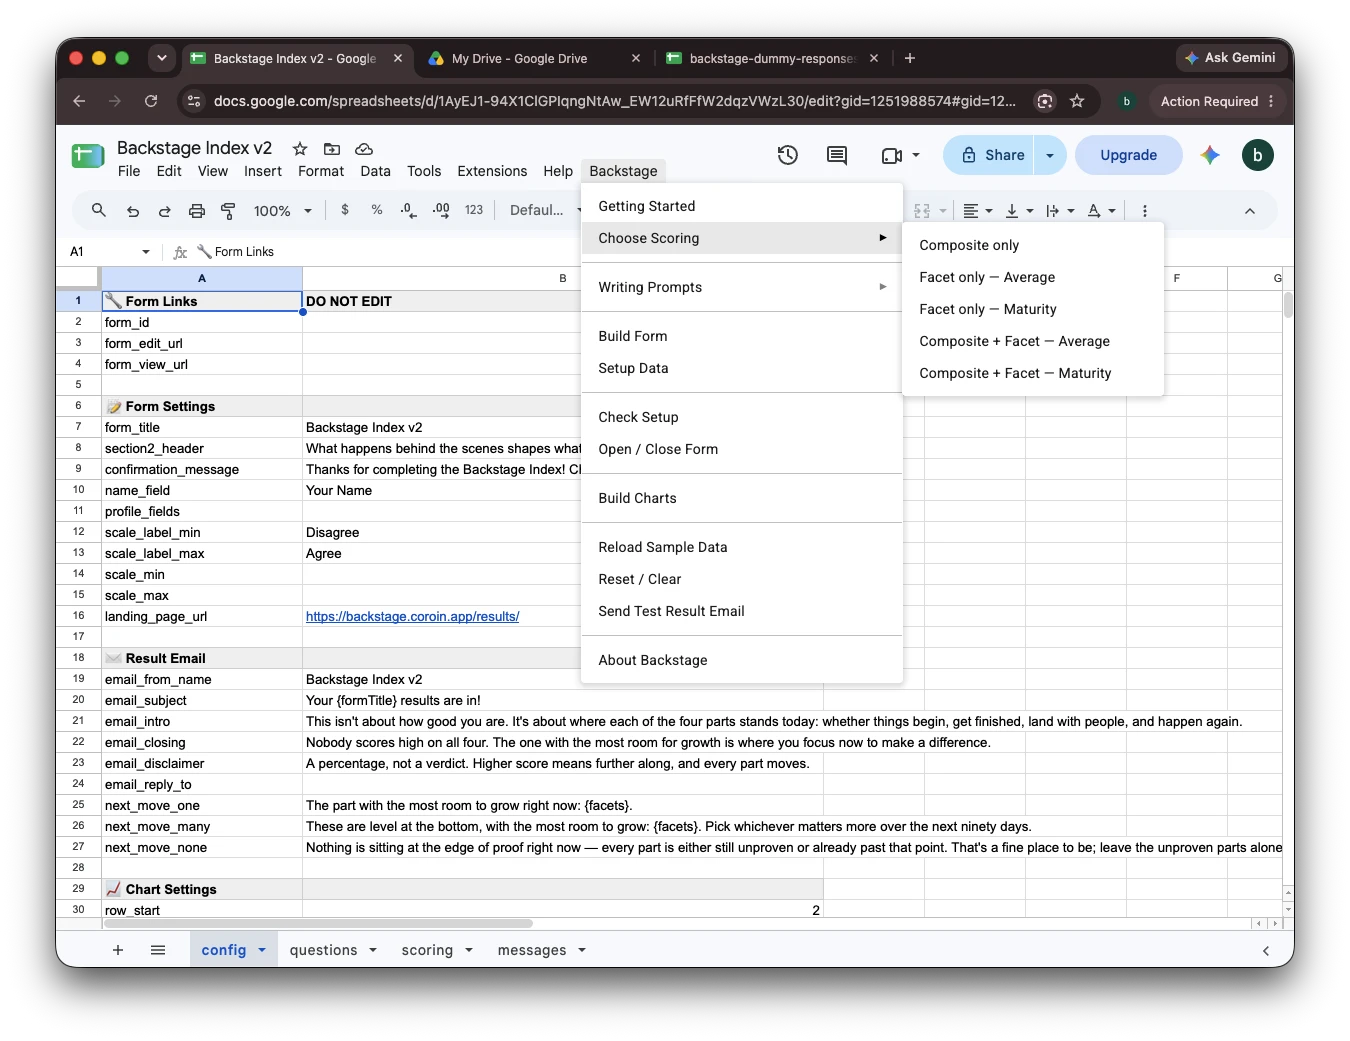
| Choice | A respondent sees |
|---|---|
| Composite only | One overall score |
| Facet only, Average | A reading per facet, no overall |
| Facet only, Maturity | A reading per facet, no overall |
| Composite + Facet, Average | Overall score, then facet detail |
| Composite + Facet, Maturity | Overall score, then facet detail |
Five rather than the six a straight three-by-two grid suggests, because Composite only has no facet for a method to act on.
Backstage > Choose Scoring sets both values in one click. Make the choice before you write anything, since all four writing prompts read it and generate different content depending on which one is running.
Average, or Maturity
Some facets measure a trait. Four statements about confidence, each sensing the same quality from a different angle. Answer three strongly and one weakly and the average is your reading, because the statements are interchangeable by design. Average is the right default whenever you are unsure.
Other facets describe a climb. A systems facet running from "it has worked at least once" through "it works most weeks without me" to "it runs without me." Those statements sit in a fixed order and each one assumes the one below it.
Averaging a climb produces a number with nothing behind it. Worse, an average lets a respondent clear the top statement, miss one near the bottom, and land comfortably in the middle. On paper they skipped a stage.
Average "I can walk," "I can run" and "I can win a marathon" and you get 2.3. Which describes nobody.
Under Maturity a respondent sits at the highest rung they have actually reached. A later rung clearing on its own never lifts an earlier gap.
Building a ladder that works
Three practical consequences, and the third is the one that bites.
You name rungs, not percentages. An Average facet resolves against a calibrated threshold table, with levels starting at 0, 50, 63, 75 and 88. A Maturity facet has no Min % at all. You write one label per rung plus one for the floor, and the ladder reads by row order.
Your reverse statement sits out. Every facet gets one statement where disagreeing is the mature answer, and under Maturity it is excluded from the ladder entirely, because a failure mode is not a rung. Write it anyway: it keeps one set of statements usable either way.
Rungs have to get harder, not merely come in an order. The climb stops at the first miss, so a ladder whose rungs are all about equally difficult has two outcomes: clear everything, or fail at rung one. Your middle rungs go unused and your distribution chart comes out as two bars. The test is difficulty rather than topic. Rung one should be the easiest honest thing a respondent could say, and the last rung the hardest to fake. If you can picture someone clearing rung three while genuinely failing rung one, you have four measures of a trait, which is what Average is for.
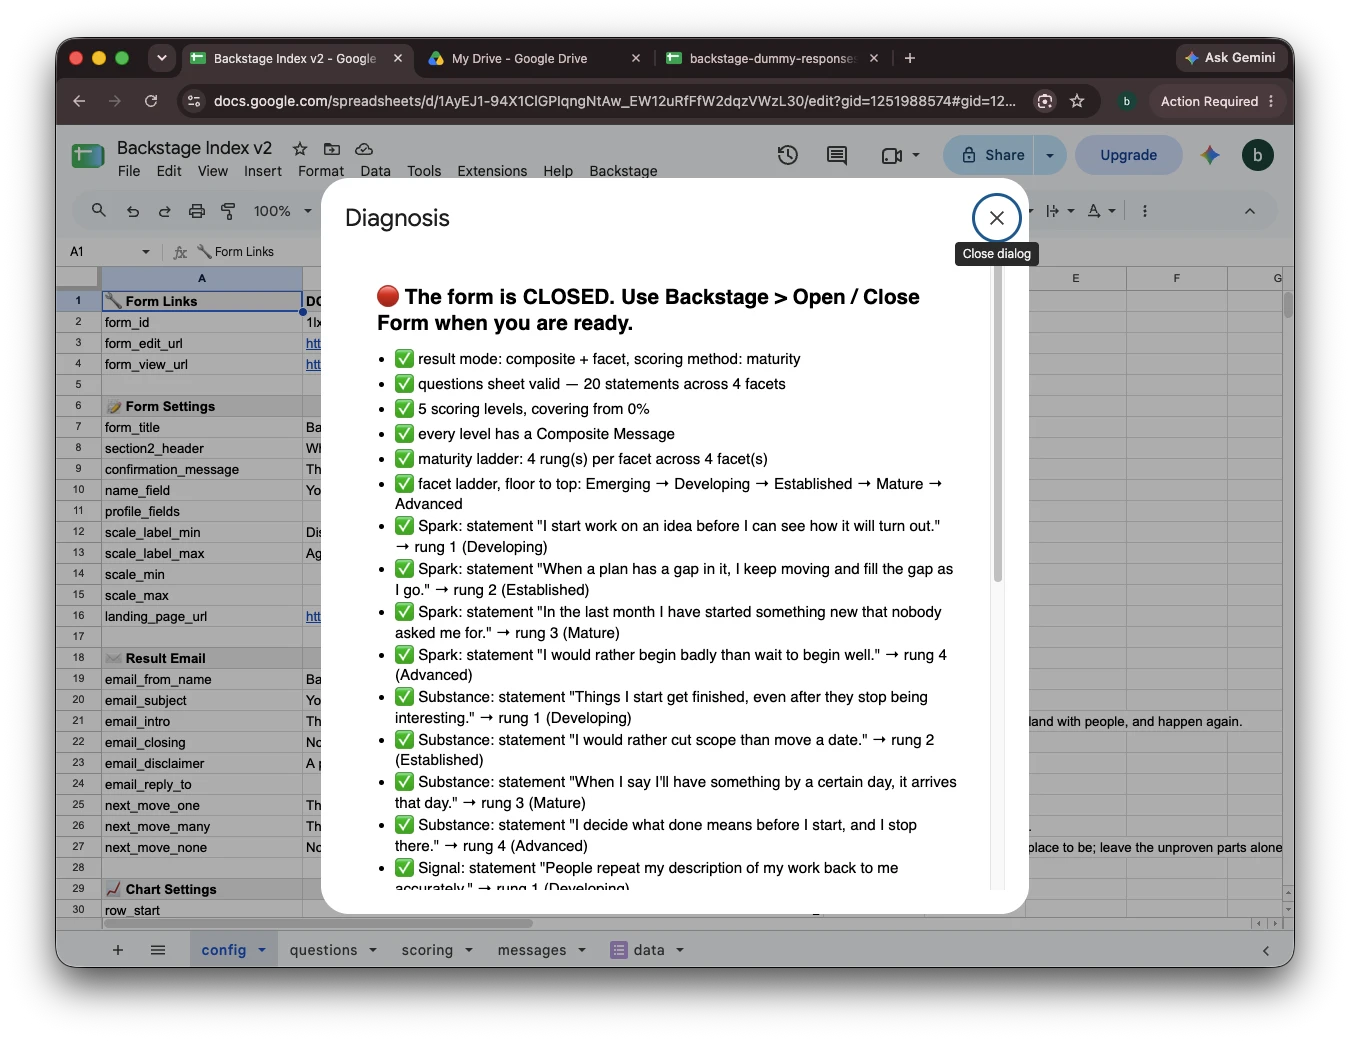
Check Setup reads your ladder back before anyone takes the survey, facet by facet, naming which statement it will treat as which rung. It confirms the counts line up and holds the publish gate until they do. Whether the order makes sense is a judgment only you can make, which is why it shows you the mapping rather than passing or failing it.
What the choice changes downstream
An overall score behaves identically either way, since the composite is always a plain average of every statement. Average and Maturity only change how a shown facet resolves.
Two config rows appear when you choose Maturity and disappear when you leave it. clear_threshold is the answer that counts as clearing a rung, defaulting to the top two points of your scale. focus_rung is the rung nominated as the next move, defaulting to two, just above the floor.
That nomination differs by method. Under Average the tool names the facet with the most room to grow. Under Maturity it names the facet sitting at the focus rung, proven but not yet past it, and it has a third piece of email copy for the occasion when nobody sits there at all.
The group radar is skipped under Maturity, since there is no percentage to average across everyone. The stacked level distribution still covers every facet.
The tool grades your levels
Build Charts writes a calibration report alongside the charts, counting how many respondents actually landed at each level. A level nobody reached is marked never used. One holding 45% or more is marked crowded. Either is a two-cell edit on the scoring sheet.
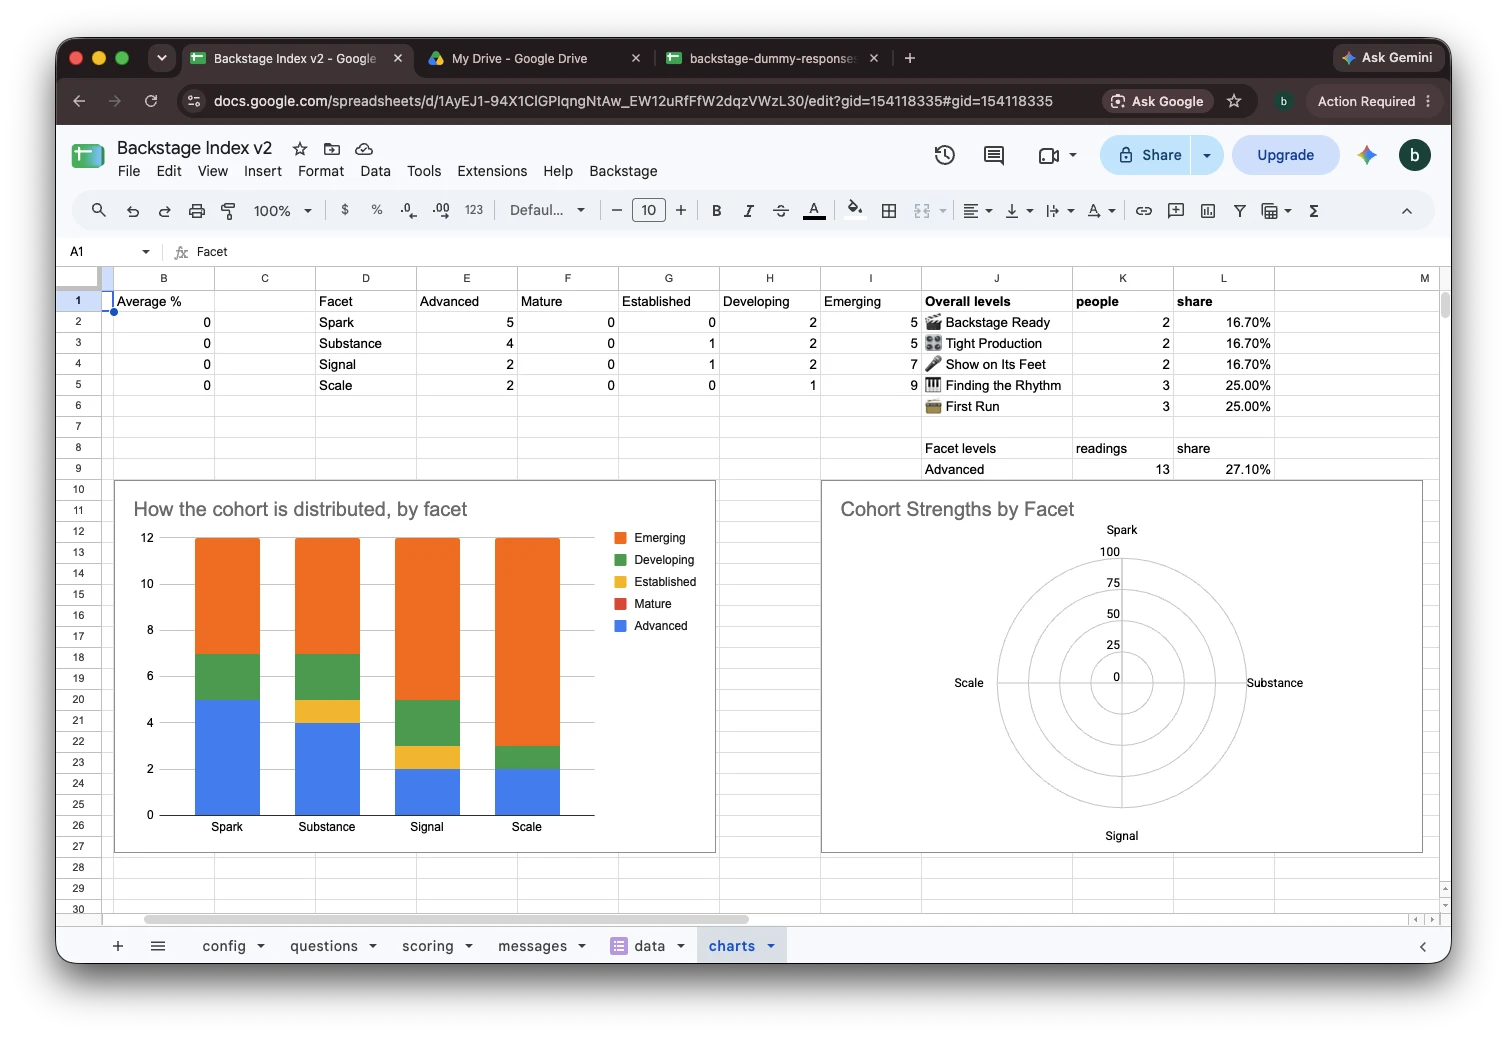
Most instruments never find out that half their answers say the same thing. This one reports it.
Trying it before you commit
Reload Sample Data loads a worked example under either method, because the shipped content already has the right shape for a ladder: four rungs plus one reverse statement per facet. Pick a Maturity choice, reload the sample, and send yourself a test result. It takes a couple of minutes and answers the question better than this article does.
Once you have built a ladder of your own, answer your own survey dishonestly. Clear the top rung, fail an early one, and check where the result puts you. A ladder that flatters you there will flatter everyone.
The tool is at coroin.app/#survey. The demo and the full guide are at backstage.coroin.app.